Algorithm for Measuring the Efficacy of Lighting Arrays
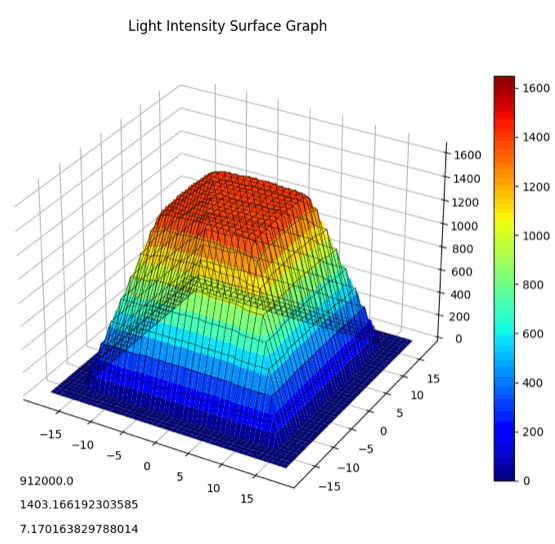
To generate 3-Dimensional illustrations, we wrote a script in Python that draws 3-Dimensional photosynthetic photon flux density (PPFD) surface graphs.
We simulate our PAR map mat in the Python program and raise each point along the z-axis to a height relative to the PAR value collected at that point. This enables you to truly visualize how the PAR is behaving in the testing environment.
Imagine your canopy is in the middle of the 3D plot; you want that area to be encapsulated with light. As you can see in the above image, the uniformity of our photon distribution is unparalleled.
This results in areas of your canopy receiving much more light than they would if you were running a lighting system with inferior uniformity, which leads to improved yields, and even a better growing experience due to more manageable canopies. The healthier photonic intensity / saturation also results in a better capability to produce higher quality flower. Part of our aim is to help bring Cannabis to its quality ceiling, and our lights are an integral step toward that goal.
Enter the algorithm for an in-depth look at the experiment.

